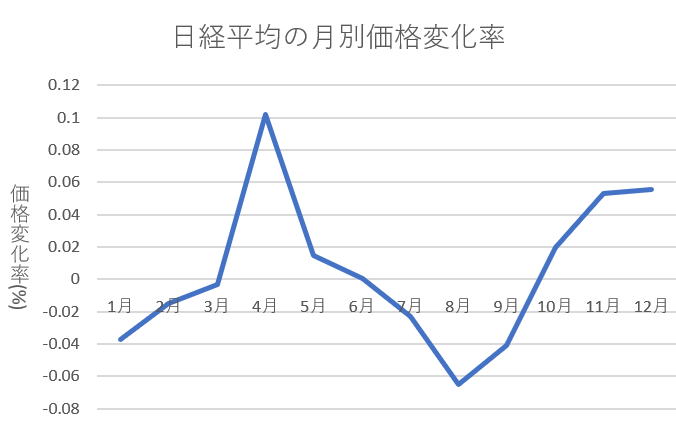
こんにちは、ミナピピン(@python_mllover)です。今日は平成元年から2020年までの日経平均の変化率を月ごとでまとめてみました。
<ソースコード>
# 日経平均の曜日別変化率を調べる
import pandas_datareader.data as web
import pandas as pd
import datetime
import numpy as np

# 日経平均株価を取得する
nikkei = web.DataReader("NIKKEI225", "fred", "1950/5/16")
year = str(1990)
start = year + '-01-01'
end = year + '-12-31'
nikkei['date'] = nikkei.index
nikkei = nikkei[nikkei['date'] > start]

nikkei['dotw'] = nikkei['date'].dt.dayofweek
nikkei = nikkei.dropna(how='any')
nikkei['change'] = nikkei['NIKKEI225'].pct_change()
nikkei['change2'] = nikkei['change'].shift(-1)

# 月ごとの集計
nikkei_month = nikkei.resample('M').mean()

# 月ごとのリターン
one = []
two = []
three = []
four = []
five = []
six = []
seven = []
eight = []
nine = []
ten = []
eleven = []
twelve = []


for i in range(1990, 2021, 1):
    try:
        one.append(nikkei_month.loc[str(i) + '-01'].iloc[0].change2)
        two.append(nikkei_month.loc[str(i) + '-02'].iloc[0].change2)
        three.append(nikkei_month.loc[str(i) + '-03'].iloc[0].change2)
        four.append(nikkei_month.loc[str(i) + '-04'].iloc[0].change2)
        five.append(nikkei_month.loc[str(i) + '-05'].iloc[0].change2)
        six.append(nikkei_month.loc[str(i) + '-06'].iloc[0].change2)
        seven.append(nikkei_month.loc[str(i) + '-07'].iloc[0].change2)
        eight.append(nikkei_month.loc[str(i) + '-08'].iloc[0].change2)
        nine.append(nikkei_month.loc[str(i) + '-09'].iloc[0].change2)
        ten.append(nikkei_month.loc[str(i) + '-10'].iloc[0].change2)
        eleven.append(nikkei_month.loc[str(i) + '-11'].iloc[0].change2)
        twelve.append(nikkei_month.loc[str(i) + '-12'].iloc[0].change2)
    except:
        pass

print(np.array(one).mean())
print(np.array(two).mean())
print(np.array(three).mean())
print(np.array(four).mean())
print(np.array(five).mean())
print(np.array(six).mean())
print(np.array(seven).mean())
print(np.array(eight).mean())
print(np.array(nine).mean())
print(np.array(ten).mean())
print(np.array(eleven).mean())
print(np.array(twelve).mean())
| 日経平均月別価格変化率データ | |
| 1月 | -0.03741 |
| 2月 | -0.01518 |
| 3月 | -0.00326 |
| 4月 | 0.101705 |
| 5月 | 0.014653 |
| 6月 | 0.00041 |
| 7月 | -0.02311 |
| 8月 | -0.06526 |
| 9月 | -0.04118 |
| 10月 | 0.019894 |
| 11月 | 0.053124 |
| 12月 | 0.05546 |

夏枯れというように言葉があるように7,8,9月のリターンは悪い傾向にあります。なんかの記事で日経平均は9月に買って4月に売却するのが良いとありましたが、たしかにこの結果を見るにそれが一番リターンが高いように思えます。


コメント
[…] 関連記事:【株価分析】日経平均の月別価格変化率を調べてみた […]
[…] 関連記事:【株価分析】日経平均の月別価格変化率を調べてみた […]